
Alphabet stock drops 12.6% after the earnings report
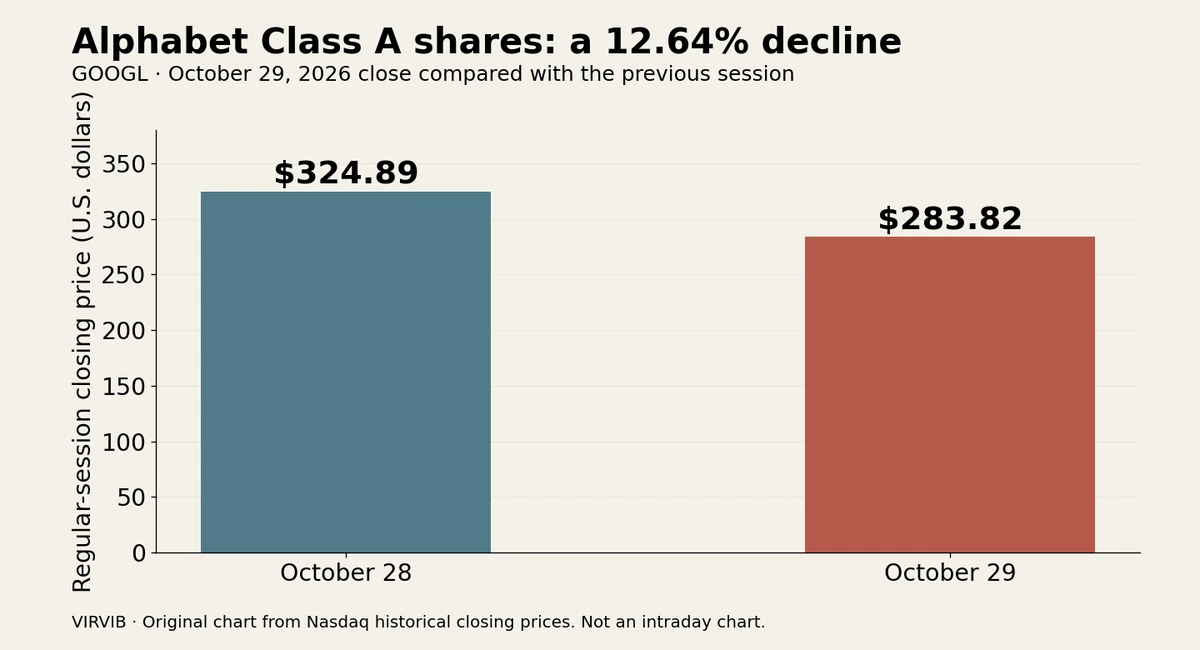
Alphabet’s Class A shares closed at $283.82 on October 29, 2026, down $41.07, or 12.64%, from the previous close of $324.89, according to Nasdaq’s historical records. The Associated Press independently reported the rounded 12.6% decline and described it as the shares’ worst day since trading began more than 20 years ago. This was the completed regular trading session after Alphabet’s October 28 earnings announcement, not an early after-hours quotation.
CNN estimated that the decline erased roughly half a trillion dollars from Alphabet’s market value. That is a valuation estimate: it describes how the market repriced the company’s equity. It is separate from the quarter’s revenue, accounting profit and free cash flow. A decline in stock-market value does not mean that Alphabet paid out that amount in cash or reported a quarterly operating loss of that size.
The stock reaction adds a new development to the earnings story below. Investors were pricing the report and their expectations for the future; the released accounts still describe the quarter that ended September 30. A falling share price and rising revenue can therefore appear together without either figure contradicting the other.
Alphabet reported third-quarter revenue of $127.6 billion on October 28, 2026, up 25% from a year earlier. Google Cloud revenue grew 103%. Yet the same report shows negative free cash flow of about $9.07 billion. These results describe different parts of the business: sales expanded rapidly while capital spending exceeded the cash generated by operations during the quarter.
Reuters independently reported that cloud revenue reached $30.71 billion, above the $29.57 billion estimate compiled by LSEG. Its updated coverage also reported an overall revenue miss and a much larger cash outflow than analysts expected. A company can beat expectations in one division while missing them at the consolidated level. Treating the cloud result as the verdict on the entire report would leave out a central part of the news.
Google Cloud’s own explanatory material describes cloud computing as on-demand access to resources over the internet. Customers can rent infrastructure, use managed platforms to build applications or subscribe to hosted software. The provider owns and manages the remote resources that make those services available. Public, private and hybrid arrangements differ in who controls the infrastructure and how it is shared.
That business model helps explain the spending question. Customers gain flexibility without having to own every server themselves, but the physical capacity still has to exist somewhere. VIRVIB analysis: shifting infrastructure from the customer’s premises to a provider’s network changes who invests in it. Strong demand can therefore coexist with a large investment bill. The commercial opportunity and the funding requirement are related, but one does not erase the other.
The quarter ended September 30. October 28 is the announcement date, not the end of the measurement period. That distinction matters when comparing the accounts with later news, forecasts or stock-market moves. The report records a completed period. Expectations about future AI usage, costs and customer demand remain expectations, even when they are discussed alongside the released numbers.
Sources: Alphabet — original Q3 2026 earnings release, October 28 ↗ · Reuters — independent results and management outlook ↗ · Alphabet — investor earnings index ↗ · Google Cloud — how cloud computing works ↗ · Google Trends — U.S. view checked October 28 ↗ · Nasdaq — GOOGL historical closes, October 28–29, 2026 ↗ · Associated Press — independent report on the October 29 selloff ↗ · CNN Business — October 29 close and estimated market-value decline ↗
What negative free cash flow does—and does not—tell readers
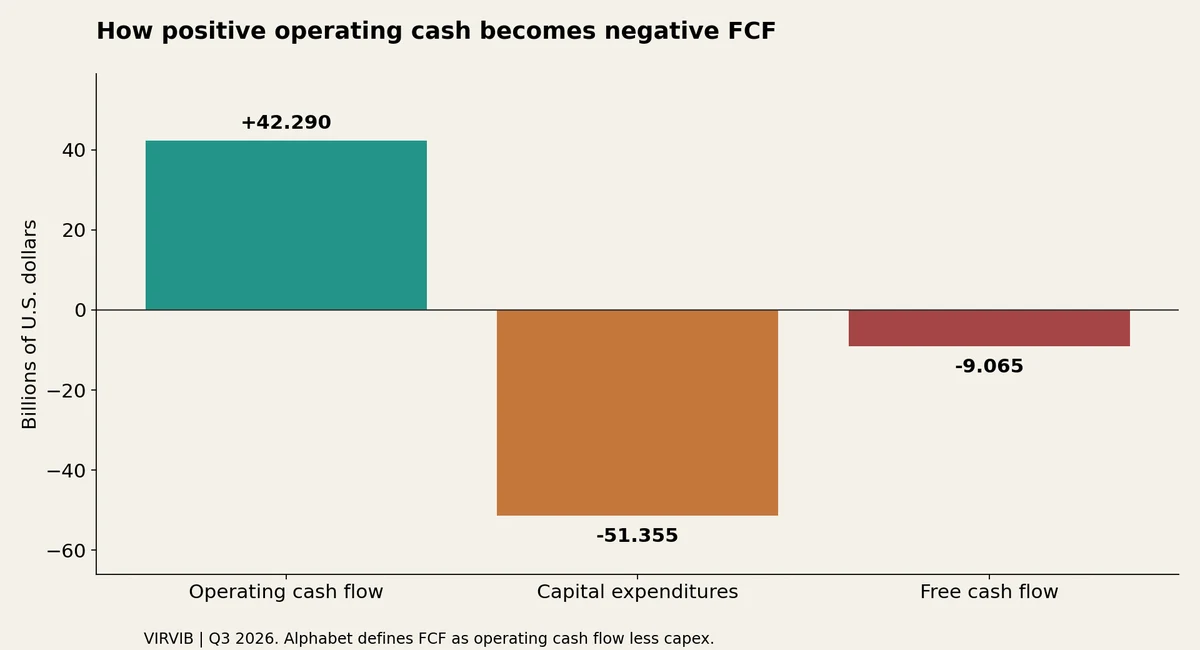
Alphabet’s reconciliation reports $42.290 billion of operating cash flow and $51.355 billion of capital expenditure. Subtracting the latter from the former produces negative $9.065 billion of free cash flow. Operating cash generation was positive; the negative result appears after the specified investment spending. Calling that calculation a loss on every sale would misread the measure.
The SEC’s guide to financial statements distinguishes cash-flow reporting from the income statement. The income statement records revenue and expenses over a period, while the cash-flow statement follows cash through operating, investing and financing activities. A balance sheet instead describes assets, liabilities and equity at a particular date. These statements connect, but they do not answer identical questions.
Capital expenditure is especially relevant here because buying long-lived equipment involves a cash payment whose accounting treatment differs from a routine operating expense. The SEC’s guide explains depreciation as allocating the cost of an asset over its useful life. An equipment purchase can therefore have a large immediate effect on investing cash flow while its cost appears in earnings over time. That timing distinction is one reason profit and cash generation can diverge.
Free cash flow is a non-GAAP measure, so its definition and reconciliation need to remain visible. SEC staff guidance says non-GAAP measures require clear labels and explains that apparently similar measures may not be comparable across companies. It also addresses the need to present the relevant GAAP comparison and avoid misleading adjustments. This is a framework for reading the report, not an allegation that Alphabet’s presentation breached a rule.
VIRVIB analysis: the negative figure identifies a funding gap under the company’s stated calculation for this quarter. It is not, by itself, a conclusion that the company cannot pay its bills. Assessing liquidity also requires cash balances, financing arrangements and obligations. Conversely, access to funding does not make the gap irrelevant. Financing can support investment while leaving open whether that investment will ultimately produce an adequate return.
Reuters reported that the quarterly cash burn increased from roughly $5.9 billion in the preceding quarter. It also quoted Chief Financial Officer Anat Ashkenazi as expecting a significant increase in capital expenditure in 2027 and near-term margin pressure from third-party cloud capacity. Those are management’s forward-looking comments as reported by Reuters. They should be separated from the completed-quarter calculation rather than presented as spending that has already occurred.
Sources: Alphabet — original Q3 2026 earnings release, October 28 ↗ · Reuters — independent results and management outlook ↗ · SEC — guide to financial statements ↗ · SEC — non-GAAP measures guidance ↗
Reading the profit lines and deciding what evidence comes next
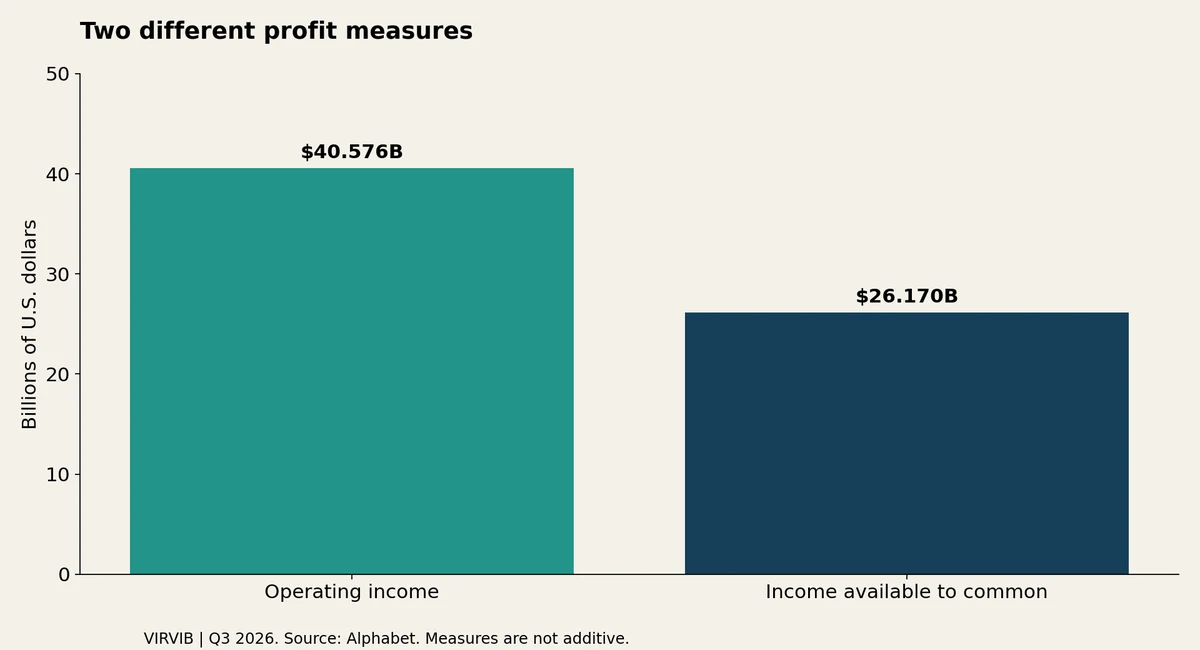
The release reports $40.6 billion of operating income, up 30%, but $26.2 billion of income available to common stockholders and diluted EPS of $2.12. The income statement also shows other expense of $8.2 billion, compared with other income of $12.8 billion a year earlier. The movement below operating income is important to the final earnings comparison.
The SEC’s statement guide explains why the sequence matters: operating results do not include every item that ultimately affects net earnings. Taxes and other income or expense also play a role. A reader who looks only at revenue growth can miss those intervening steps. A reader who sees a lower final earnings figure should likewise avoid assuming that every underlying operating business deteriorated by the same amount.
VIRVIB analysis: three questions organize this report. How much service demand became recognized revenue? How much operating profit did the company retain after its operating costs? How much cash remained after capital investment? Those questions require different lines in the accounts. Choosing only the most favorable number, or only the most unfavorable one, produces an incomplete account of the quarter.
The forecast comparison has its own limits. An analyst consensus describes expectations collected before results; it is not the same thing as the company’s previous-year performance. Beating a forecast and growing year over year are separate achievements. Missing a forecast can coexist with substantial growth. Reuters’ account of the overall revenue miss and the cloud beat demonstrates that distinction within this single announcement.
The broader cloud-investment story also includes Microsoft, whose October 28 report is covered separately on VIRVIB. Comparing suppliers requires care about segment definitions and reporting periods. A product-level growth rate is not automatically comparable with another company’s wider cloud category. The useful comparison starts with what each metric includes, rather than ranking the companies by whichever percentage happens to be largest.
For subsequent coverage, the evidence to watch is the relationship between recognized revenue, operating cash generation and investment over multiple quarters. Management commentary can explain plans, but later financial statements show whether those plans translated into results. This report does not predict a stock price or declare the AI investment cycle a success or failure. It establishes the immediate tension in Alphabet’s October 28 results: expanding cloud demand and a substantial cash requirement are both present.
Sources: Alphabet — original Q3 2026 earnings release, October 28 ↗ · Reuters — independent results and management outlook ↗ · SEC — guide to financial statements ↗ · VIRVIB — Microsoft’s October 28 earnings explained ↗
Why this story is in the editionGoogle Trends U.S. RSS retrieved October 30, 2026 included “alphabet stock drop 500 billion,” timestamped October 29 at 21:40 PDT. This is evidence of current search interest, not a national ranking or exact search volume. The roughly half-trillion market-value estimate is attributed to CNN and distinguished from company cash flow.
Prepared with AI assistance. Source-based reporting checked on 2026-10-30. This article does not update automatically. Read our editorial standards.