Microsoft bond offering: priced, with settlement still ahead
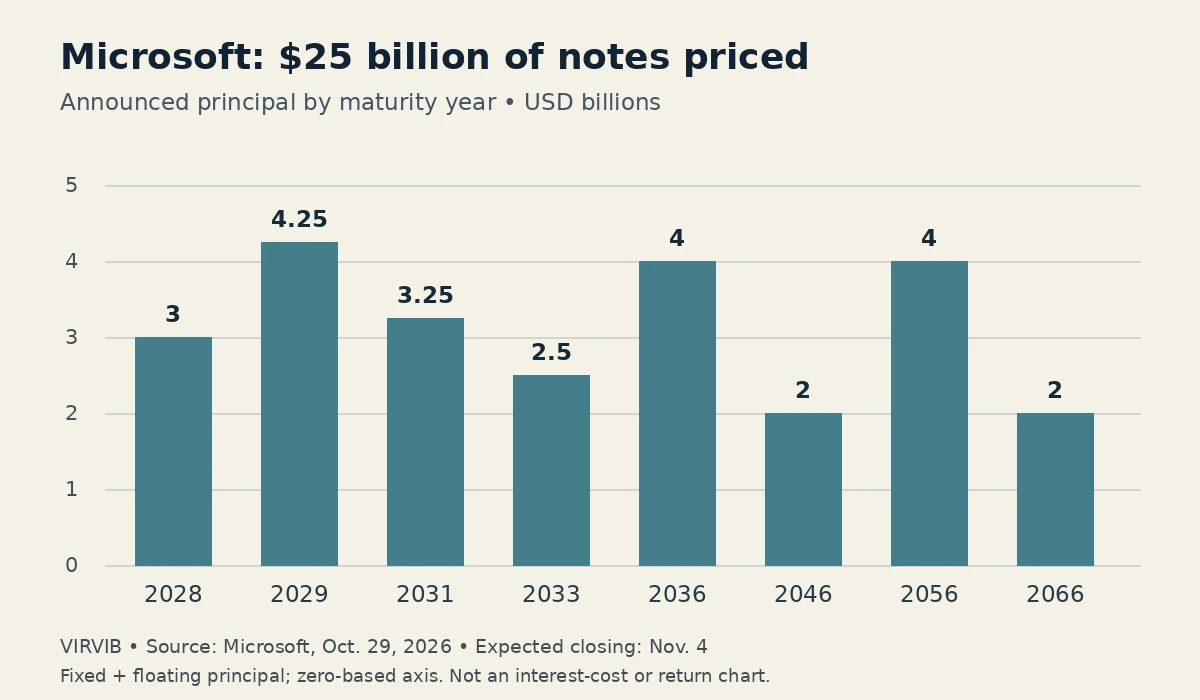
Microsoft announced on October 29, 2026 that it had priced $25 billion of senior unsecured notes. The company expects the offering to close on November 4; pricing is not confirmation that settlement has occurred. This adds a financing development to the October 28 earnings report discussed below, while preserving this article’s original publication date and link.
The ten tranches include $2 billion of floating-rate notes and $23 billion of fixed-rate notes, calculated by summing the amounts in Microsoft’s announcement. Fixed coupons range from 4.85% to 6.35%; the listed maturities run from November 2028 to November 2066. The chart groups principal by maturity year, combining fixed and floating notes where their years match. It shows principal amounts, not interest costs or investor returns.
Microsoft’s preliminary prospectus says proceeds may fund working capital, capital expenditure, share repurchases, acquisitions or existing-debt repayment. It describes the notes as unsecured obligations ranking alongside other unsecured, unsubordinated debt. That broad use-of-proceeds statement does not earmark the entire offering for AI infrastructure. The preliminary filing left deal amounts and rates blank; the company’s subsequent pricing announcement supplies the final announced terms.
Reuters separately reported plans for roughly $25 billion of borrowing and said two sources confirmed the planned transaction. Its account described the return to the U.S. investment-grade bond market after more than nine years and reported management’s intention to seek funding when attractive to preserve financial flexibility. Those independently reported plans should be read alongside the company’s more specific pricing release, rather than treating an earlier estimate as the latest status.
VIRVIB analysis: the financing question differs from the sales question. Borrowing creates a repayment obligation; it does not count as another customer buying Azure services. The SEC’s financial-statement guide distinguishes financing cash flows from operating activity. A company can expand revenue and still choose external funding, while the availability of debt cannot establish that every investment it supports will earn a satisfactory return. The next dated milestone here is the expected November 4 closing, followed by disclosures showing how financing and investment appear in the accounts.
Sources: Microsoft — October 29 final announced debt pricing and expected closing ↗ · Microsoft — October 29 preliminary prospectus filed with SEC ↗ · Reuters via Schwab — independent report on Microsoft bond plans ↗ · SEC — guide to financial statements ↗
Microsoft earnings: Azure growth is the headline, but definitions matter

Microsoft reported revenue of $92.3 billion, up 19%, for the quarter ended September 30, 2026. Its October 28 earnings release puts Azure growth at 48%. Newly disclosed dollar sales and revised segments make this a consequential change in how readers can assess the cloud business.
Reuters independently reported Azure revenue of $33.17 billion, above the $32.84 billion estimate from Visible Alpha. Its report put the prior quarter at $29.4 billion. Those comparisons answer different questions. The annual growth rate measures expansion over twelve months; the preceding quarter shows the more recent scale of the business; the analyst estimate describes what one survey expected before the announcement.
“MSFT stock” and “MSFT earnings” appeared in Google Trends’ United States trending-search view checked on October 28. Their appearance indicates current interest, without establishing that Microsoft was America’s largest trend. The question worth answering is what the released accounts show about the business behind the ticker, particularly when familiar product names now sit within different reporting categories.
Azure’s own educational material explains cloud computing as delivering resources such as servers, storage, databases and software over the internet. Customers can rent infrastructure as needed, use a managed development platform or subscribe to hosted applications. Public-cloud infrastructure is operated by a provider, while private and hybrid arrangements allocate resources differently. That range helps explain why “cloud” describes several business activities rather than one interchangeable product.
For a customer, the operational appeal can include adding computing capacity without buying and maintaining every machine locally. For the supplier, however, the revenue number is only one part of the economic picture. VIRVIB analysis: demand for a service and the cost of supplying it are separate questions. A growing sales line establishes commercial scale; it cannot, by itself, establish the return on every data-center investment supporting that service.
The new dollar disclosure also makes comparisons with other providers more concrete. Reuters’ September reporting explained that the change would offer a clearer comparison with Amazon and Alphabet. Even with a dollar amount, readers should compare the scope of the services counted and the reporting periods. Similar labels do not guarantee identical businesses, and a percentage increase does not reveal the size of the starting base.
Sources: Microsoft — October 28 FY27 Q1 earnings release ↗ · Reuters via CNA — independent Azure results report ↗ · Reuters — September 2 reporting changes ↗ · Microsoft Azure — what cloud computing means ↗ · Google Trends — U.S. trends checked October 28 ↗
Agents and Infra versus Devices and Consumer: the new map
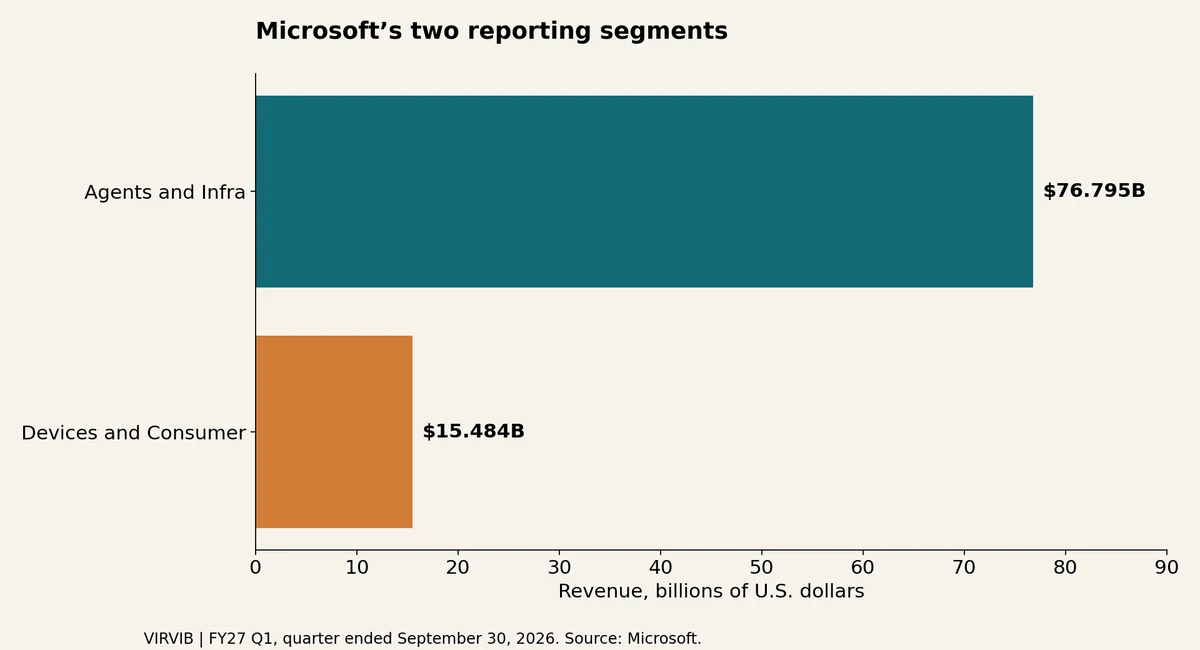
Microsoft announced its reporting changes in September, before this earnings release. Its presentation furnished to the Securities and Exchange Commission replaced three segments with two: Agents and Infra, and Devices and Consumer. The former groups its cloud, business applications, licensing, consulting and support activities. The latter includes Windows, Xbox and advertising. The reorganization changes how readers locate results that previously appeared in other parts of the accounts.
The presentation also changes the boundaries within those segments. GitHub cloud and other developer cloud services, together with Security Copilot, move from Azure into Microsoft 365 commercial cloud. Healthcare and Life Sciences cloud moves into Industry solutions. Under the company’s description, Azure becomes more focused on consumption-based cloud and infrastructure. That is a material reason to consult the definitions before comparing the new Azure label with an older series.
Agents and Infra reported $76.8 billion in revenue, up 25%; Devices and Consumer reported $15.5 billion, down 3%. Microsoft recast prior periods for comparison. Those figures provide a consistent basis for tracking the new segments.
VIRVIB analysis: moving a product between reporting categories does not, on its own, mean that a customer bought more of it. A useful comparison needs both a consistent boundary and a consistent period. The new presentation can improve visibility, but it also requires readers to retire shortcuts built around the former three-segment arrangement. The name on a chart is a definition that needs checking, not merely a heading.
Reuters reported in September that Microsoft had previously disclosed an Azure growth rate without quarterly Azure sales. The additional dollar figure addresses that information gap. It lets readers see the scale behind a growth percentage and build a more direct comparison over time. It does not disclose every individual customer contract or provide a complete standalone Azure profit-and-loss account.
A practical way to read this quarter is to begin with consolidated revenue, then examine the two segments, then identify the products included in each metric. Do not add Microsoft Cloud revenue to segment revenue as though every label were a separate source of sales. Some figures describe activities within the larger total. VIRVIB analysis: the purpose of a reporting map is to show where revenue belongs; treating overlapping measures as additive would overstate the size of the business.
Sources: Microsoft — October 28 FY27 Q1 earnings release ↗ · Microsoft SEC exhibit — September segment changes and metric definitions ↗ · Reuters — September 2 reporting changes ↗
Why 32% earnings growth and 18% adjusted growth can both be correct
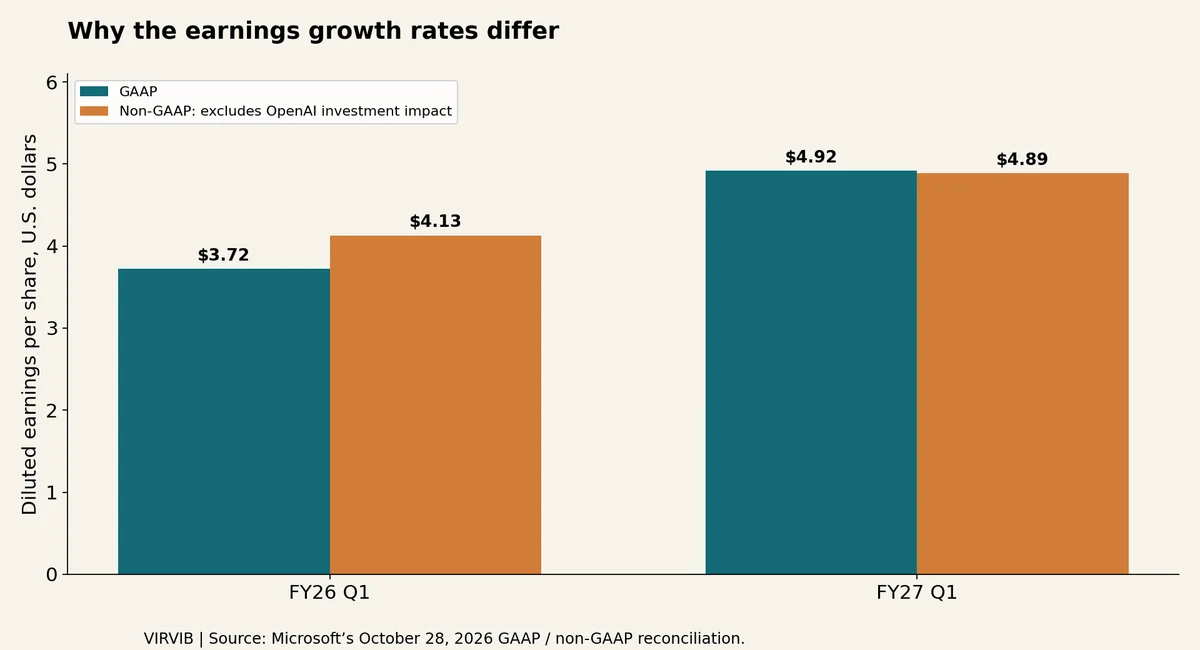
Diluted EPS was $4.92 under GAAP, up 32%, versus $4.89 on Microsoft’s non-GAAP basis, up 18%. The adjustment excludes OpenAI investments: a three-cent gain this quarter and a forty-one-cent loss a year earlier.
VIRVIB calculation: $4.89 divided by the comparable prior $4.13, minus one, gives approximately 18% growth. The equivalent GAAP calculation uses $4.92 and $3.72 and yields approximately 32%. The different bases explain the gap.
The SEC’s staff guidance explains why labels and reconciliations matter when companies present non-GAAP measures. It warns that inconsistent adjustments across periods can mislead, and that a non-GAAP label must explain what the measure represents. It also says the comparable GAAP measure should receive equal or greater prominence in the relevant disclosures. That guidance supplies a reading framework; it is not a finding that Microsoft violated a rule in this release.
The SEC’s financial-statement guide adds another useful distinction. An income statement measures revenue, expenses and earnings over a period. A cash-flow statement tracks movements of cash, including operating, investing and financing activity. A balance sheet instead shows assets, liabilities and equity at a point in time. Revenue, net income and cash available after investment answer different questions, even when all relate to the same company and quarter.
For this report, that means an earnings growth rate should not stand in for a complete verdict on AI investment. VIRVIB analysis: assessing the economics requires connecting customer demand with operating costs, capital investment and cash generation over time. The Azure sales figure improves one part of that assessment. The OpenAI reconciliation clarifies another. Neither supplies a forecast of the stock price or a guarantee about the returns on future spending.
Microsoft scheduled its earnings webcast for 2:30 p.m. Pacific, or 5:30 p.m. Eastern, on October 28, with forward-looking guidance to be provided in connection with the announcement. Readers should distinguish that subsequent outlook from the completed quarter. The released results establish a dated baseline: expanding cloud sales, a clearer reporting map and earnings comparisons whose investment adjustments need to be read explicitly. Future guidance and later quarters will determine how that baseline develops.
Sources: Microsoft — October 28 FY27 Q1 earnings release ↗ · SEC — non-GAAP financial measures guidance ↗ · SEC — guide to financial statements ↗ · Microsoft — October 7 announcement of release and webcast timing ↗
Why this story is in the editionGoogle Trends U.S. RSS retrieved October 30 included “bonds,” timestamped October 29 at 22:30 PDT, with a Microsoft debt-offering news link. This supports current interest, not a national rank or exact search volume. The new pricing development is integrated into existing earnings coverage to avoid a duplicate article.
Prepared with AI assistance. Source-based reporting checked on 2026-10-30. This article does not update automatically. Read our editorial standards.