HOUSE CONTROL · DDHQ MODEL
79% Democratic probability
Seat projection 237 D / 198 R · 218 D seats for control
Win probability, not projected vote share. Snapshot October 25.
The races. The candidates. The paths to a majority.
A geographic guide to the House and Senate — with the forecast separated from the facts.
Follow candidates with the star beside their name. Your choices stay in this browser; no account is needed.
Loading candidate coverage…
Changes identify differences in the source data, not why voters changed their minds. A model update is not a change in counted votes. We show a reason only when the source supplies it.
Choose a party for each of the 35 contested seats. The baseline includes the 65 seats not on the 2026 ballot: 34 Democratic-aligned (including two independents) and 31 Republican. New independent winners remain separate; their future caucus is not assumed.
Saved locally. A share link includes only your hypothetical party picks, never your watchlist or browsing history. Majority calculations assume the existing two independents continue caucusing with Democrats. A Republican vice president breaks a 50–50 tie. Sources: 2026 seat map · U.S. Senate roster.
Checking results availability…
Reported vote share is separate from forecast win probability. A lead is not a victory; a race call is attributed to the source and may precede certification.
Seat projection 237 D / 198 R · 218 D seats for control
Win probability, not projected vote share. Snapshot October 25.
Seat projection 51 D / 49 R · 51 D seats for control
Win probability, not projected vote share. Snapshot October 25.
The Senate is the U.S. Senate, also called the upper chamber. The other chamber is the House of Representatives. Portraits use a graphic treatment of credited file photographs; missing portraits show initials. A forecast describes uncertainty before voting is complete; this page reports no election winners.
Senate colors identify DDHQ’s favored party in rated races; purple means Toss Up and gray means no Senate election in this snapshot. Colors are not election results.
Geographic boundaries from Census-derived public-domain state geometry. Alaska and Hawaii are insets. House mode aggregates district favorites; it does not draw or substitute for congressional district boundaries.
Candidate names and party-level probabilities from the DDHQ model. This is the model’s candidate coverage, not a certification of every name on every ballot. FEC registrants are available separately below.
A full House needs 218 seats for a majority. A national vote lead is not a seat count.
Democrats need 51 seats for an outright majority. A 50–50 chamber gives the Republican vice president the tie-breaking role.
Seat projections and control probabilities are different model outputs; neither is a called result.
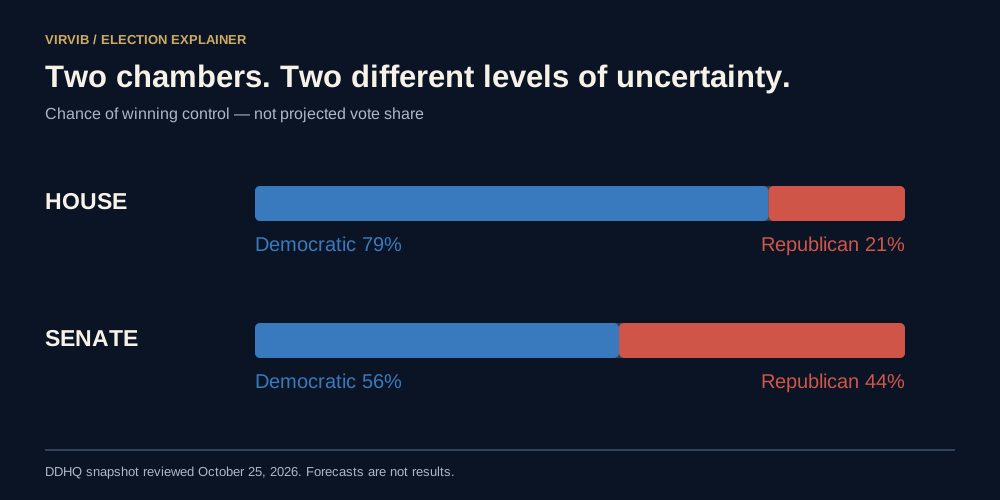
Democrats have the advantage in the Decision Desk HQ forecast reviewed for this report on October 25, 2026, but the two chambers present different levels of uncertainty. DDHQ gives Democrats a 79% probability of winning the House, compared with 21% for Republicans. Its Senate forecast is much closer: 56% Democratic control and 44% Republican control. The displayed seat projections are 237 Democrats to 198 Republicans in the House and 51 to 49 in the Senate. These are model outputs before the election, not counted ballots or certified results.
VIRVIB analysis: the useful headline is therefore an advantage in the House and a narrow edge in the Senate within this particular model. It would be a mistake to compress those separate findings into a claim that Democrats are certain to win Congress. A party can be favored in each chamber without being assured of winning either, and the probability of winning both cannot be recovered by simply reading the larger percentage from one chart.
Consider what the lower-probability side means. A 21% chance is not zero. A 44% chance is close to an even contest. If the less-favored party wins, the outcome alone does not prove that probability forecasting was useless. The question is whether forecasts assigned realistic uncertainty across many comparable elections. This page shows the snapshot and its source so readers can distinguish what the forecast said from what the election eventually delivers.
Sources: DDHQ — 2026 Senate forecast · DDHQ — 2026 House forecast
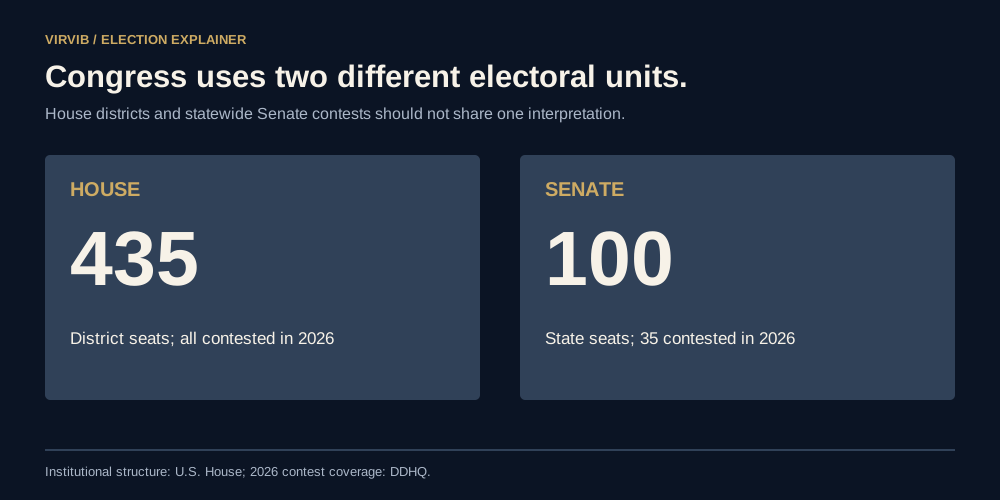
The United States Congress has two chambers: the House of Representatives and the Senate. The House has 435 voting representatives, with representation allocated among states according to population. Representatives serve two-year terms and are chosen in congressional districts. The Senate map instead organizes contests by state, which is why one nationwide map cannot tell the complete story of both chambers.
VIRVIB analysis: a state can support one party in a statewide Senate contest while electing House members from both parties. Coloring the whole state by its Senate favorite should never be read as a claim that every House district inside it will vote the same way. The state selector and district list have different jobs. The state map locates a contest. The district records reveal the smaller units whose seats add up to the House majority.
At full membership, 218 House seats are more than half of 435. That number is a seat threshold, not a requirement to win 50% of all votes cast nationwide. Imagine two parties receiving equal national vote totals but distributing their support differently across districts. The seat count could still differ because representatives are elected district by district. This is a mathematical illustration of the system, not a numerical forecast of a particular state. Readers should compare national summaries with the actual races making up those totals.
Sources: U.S. House — the House explained
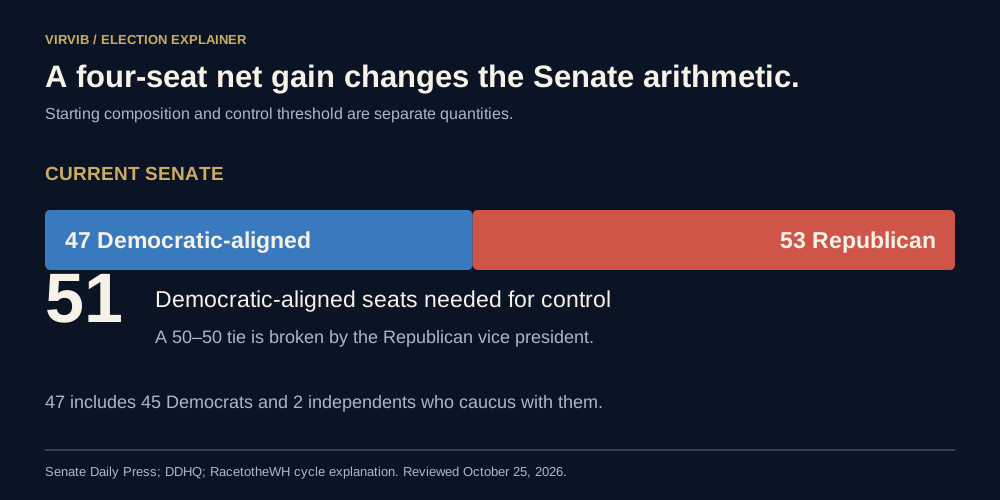
The Senate Daily Press lists the chamber’s party lineup as 53 Republicans, 45 Democrats and two independents who caucus with Democrats. Its Class II roster includes the seats expiring in January 2027, alongside the special-election context. In the forecast’s full-chamber calculation, seats not on the ballot remain part of the total. The Democratic-aligned starting bloc is therefore different from a count of Democratic candidates running this November.
VIRVIB analysis: control depends on additions and subtractions together. If a party gains four seats but loses one of its own, its net gain is three. Conversely, protecting an existing seat can be just as important to the final arithmetic as capturing a seat currently held by the other party. A map showing only possible flips can conceal that defensive requirement.
The Republican vice president also matters in a tied Senate. RacetotheWH’s cycle explanation notes that Democrats require a four-seat net gain for a 51–49 majority, while a 50–50 split would be broken by Vice President JD Vance. That is why a chart describing “50 seats” needs a definition of control rather than an assumption that both parties face identical thresholds. Independent candidates create another distinction: their personal party label and any future caucus affiliation are separate facts. This guide should not automatically color every independent as a Democrat or Republican merely to make the map simpler.
Sources: Senate Daily Press — party lineup and seats · RacetotheWH — Senate forecast and model overview
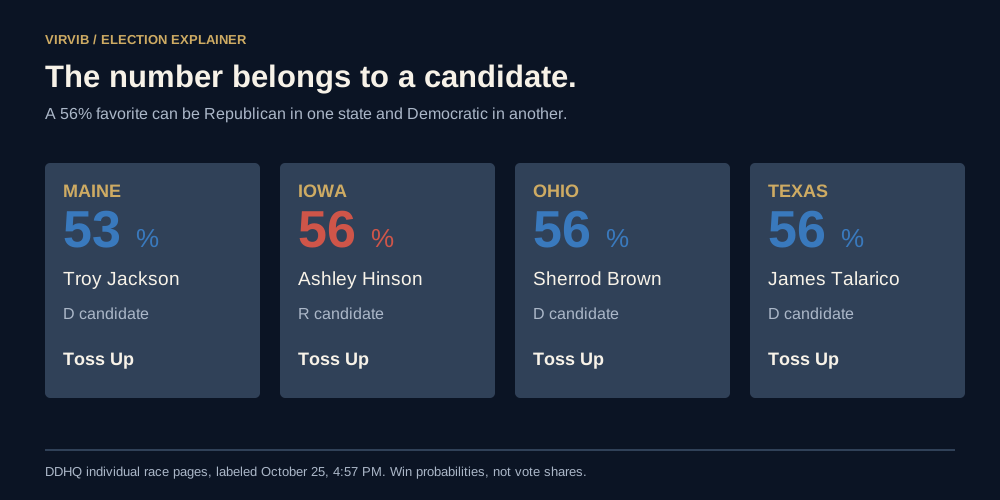
DDHQ’s individual race pages identify the favorites behind four toss-up percentages. Maine gives Troy Jackson 53% and Susan Collins 47%. Iowa gives Ashley Hinson 56% and Josh Turek 44%. Ohio gives Sherrod Brown 56% and Jon Husted 44%. Texas gives James Talarico 56% and Ken Paxton 44%. The pages reviewed carry the update label October 25, 4:57 PM; the displayed label itself does not specify a timezone.
VIRVIB analysis: these examples expose an easy transcription error. A list showing a state and “56%” does not mean the Democrat has that probability. Iowa’s number belongs to the Republican favorite, while the same headline number in Ohio and Texas belongs to the Democratic favorite. Every probability in the interactive table therefore needs to stay attached to a named candidate or an explicitly identified party.
The toss-up designation also does not require exactly 50–50 odds. It describes a competitive category, while the numerical estimate can still favor one side slightly. Readers should resist treating a small difference between nearby probabilities as a dramatic political development without examining what changed. A move from 53 to 54 is a one-point shift in modeled chance, not proof that an additional one percent of voters changed their preference. The state pages and the polling figures measure different things, even when they appear beside one another.
Sources: DDHQ — Maine forecast · DDHQ — Iowa forecast · DDHQ — Ohio forecast · DDHQ — Texas forecast
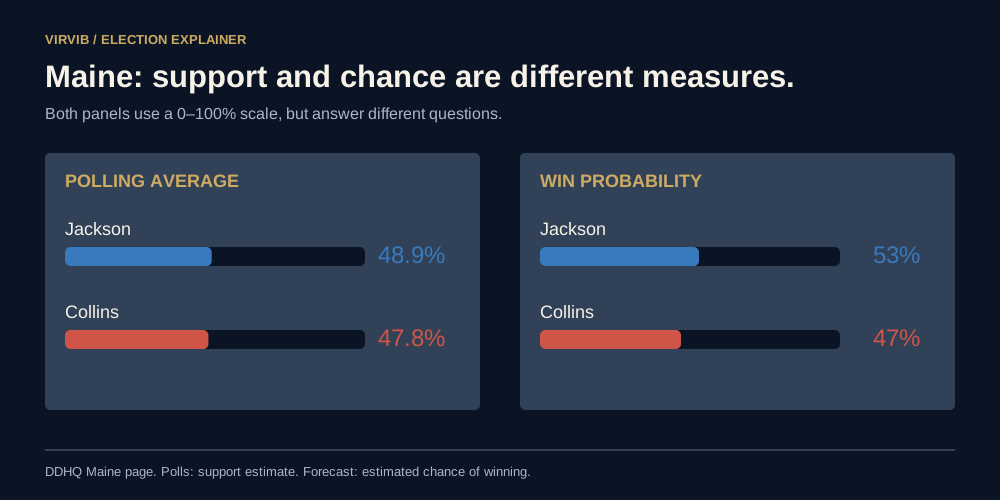
Maine’s DDHQ page displays a polling average of 48.9% for Jackson and 47.8% for Collins, alongside their different win probabilities. Texas shows Talarico at 48.3% and Paxton at 45.5% in its displayed polling average. Those figures describe estimated support in an aggregation of polls. They do not give the candidates’ shares of a future certified count. Nor should the unallocated remainder automatically be assigned to the leading candidate.
VIRVIB analysis: suppose a hypothetical candidate has a 60% chance of winning but is projected to receive 50.5% of the vote. There is no contradiction. The first number concerns how often the candidate finishes ahead across uncertain possible outcomes. The second describes a possible center of the vote-share distribution. The candidate could have a modest expected margin while still being more likely than not to win.
A second hypothetical illustrates why the scale matters. Raising a polling estimate from 48% to 49% is a one-percentage-point change in support. Raising a modeled chance from 48% to 49% is a one-point change in win probability. Both use percent signs, but they answer different questions. The graphics on this page label the measure rather than relying on color alone. A reader comparing candidates should first ask whether the bar is showing polling, forecasted vote share, win probability, seats or a change over time.
Sources: DDHQ — Maine forecast · DDHQ — Texas forecast
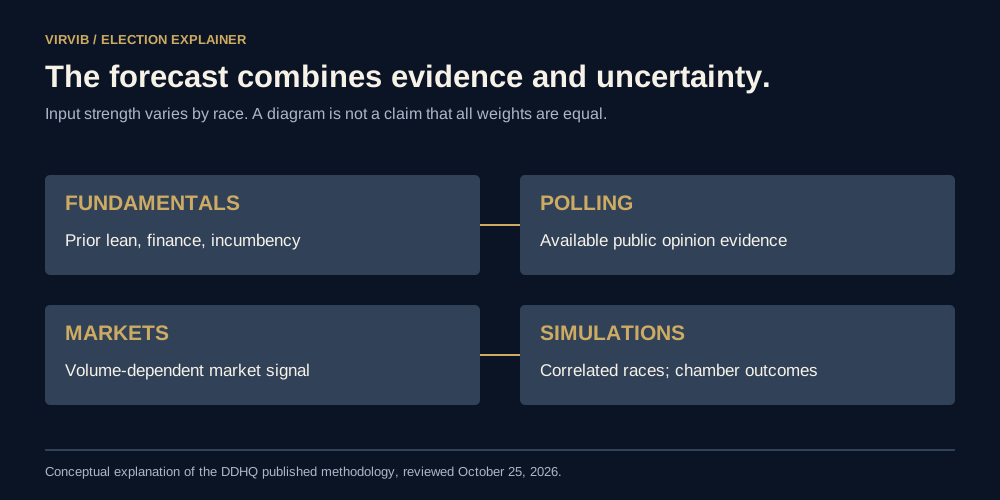
DDHQ describes a system combining structural fundamentals, polling and prediction-market information. Its methodology includes prior electoral lean, the national political environment, campaign-finance information and incumbency. Polling input varies with the available polling, and market influence is linked to effective trading volume. Chamber outcomes are simulated with a shared national factor, allowing races to move together rather than treating every contest as entirely independent.
VIRVIB analysis: the shared-factor point is central to interpreting control odds. If the same kind of polling error affects several states in the same direction, a party may lose multiple close contests together. Adding together individual favorites as if each outcome were fixed would miss that possibility. A chamber forecast is a distribution of possible seat totals, not merely a coloring exercise that awards every slightly favored race to its current leader.
More simulations do not remove uncertainty in the underlying evidence. They help calculate the consequences of the assumptions supplied to the model. A million simulated elections are not a million observations of actual voters. The number of runs should therefore not be used as a guarantee of precision. In a hypothetical model that always assumes the wrong electorate, increasing the simulation count would make its arithmetic more stable without fixing the mistaken assumption. The source, update date, definitions and methodology deserve at least as much attention as the headline probability.
Sources: DDHQ — forecast methodology
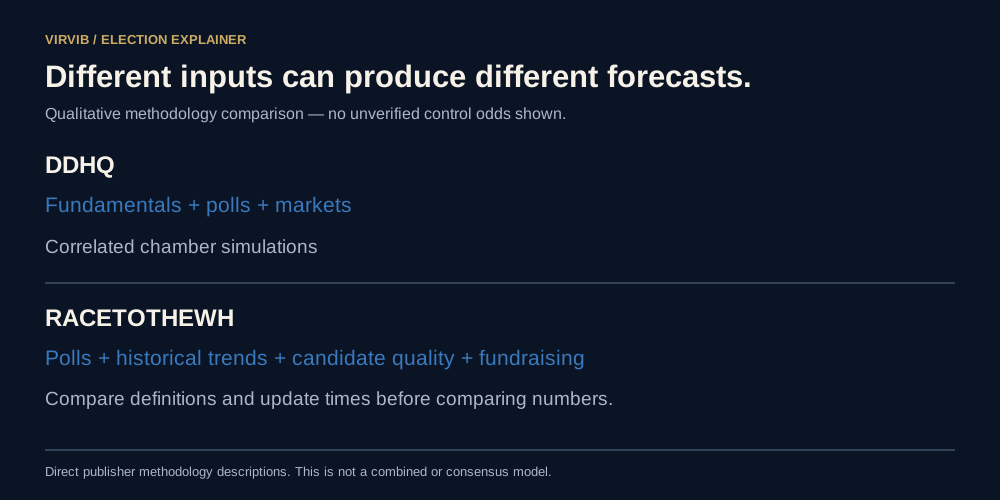
RacetotheWH explains that its Senate forecast uses polling, historical trends, candidate quality and fundraising, and simulates the election 50,000 times a day. The publicly retrieved overview did not expose an unambiguous current national control percentage, so this report does not manufacture a number for a side-by-side chart. Its methodology overview remains linked for readers who want to compare how another publisher frames the same election.
VIRVIB analysis: disagreement is not resolved by taking whichever number produces the most exciting headline. First compare the date, the office and the event being forecast. A probability of 51 or more Democratic seats may not be identical to a probability of Democratic organizational control if independent winners could affect the balance. An election-day forecast and an estimate of what would happen if voting took place today can also answer different questions.
Next compare how the models handle incomplete evidence. One may react more strongly to a recent poll. Another may retain more influence from the prior partisan composition of a state. Those choices can change probabilities without either model claiming to have counted votes. This guide uses one clearly identified numerical baseline so that its colors, tables and summary agree with one another. Alternative sources are there for comparison, not blended into an invented “consensus” percentage. Any future revision should replace the whole dated snapshot consistently rather than mixing figures from different days.
The Senate forecast covers 35 contests. Its state table places Maine, Iowa, Ohio and Texas in the toss-up category, Alaska and Michigan in Lean Democratic, and Kansas and South Carolina in Lean Republican. The House forecast separately covers all 435 districts. Those distinct units explain why a useful election explorer needs both a state overview and a district-level list.
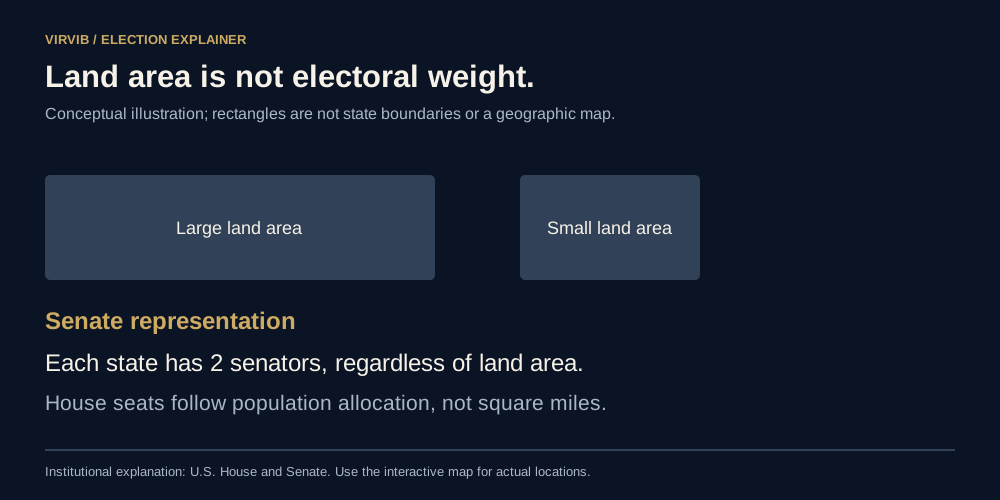
VIRVIB analysis: large geographic shapes can dominate a conventional map even though land area is not the number of seats or the number of voters. A seat chart provides a complementary view. In the Senate, each state is represented equally in the chamber regardless of physical size. In the House, the distribution of districts reflects population allocation, so a state’s collection of district records matters more than its visual footprint.
The map legend must also distinguish an uncompetitive race from a state without a Senate election this year. Gray should not mean that voters are undecided, that no candidate has registered or that the state has been forgotten. It should mean exactly what the legend says. Candidate search adds a third layer: a filing record can identify someone who entered a campaign without establishing that the person remains on the November ballot. The directory’s scope and status labels should remain visible when the reader changes state or chamber filters.
Sources: DDHQ — 2026 Senate forecast · DDHQ — 2026 House forecast
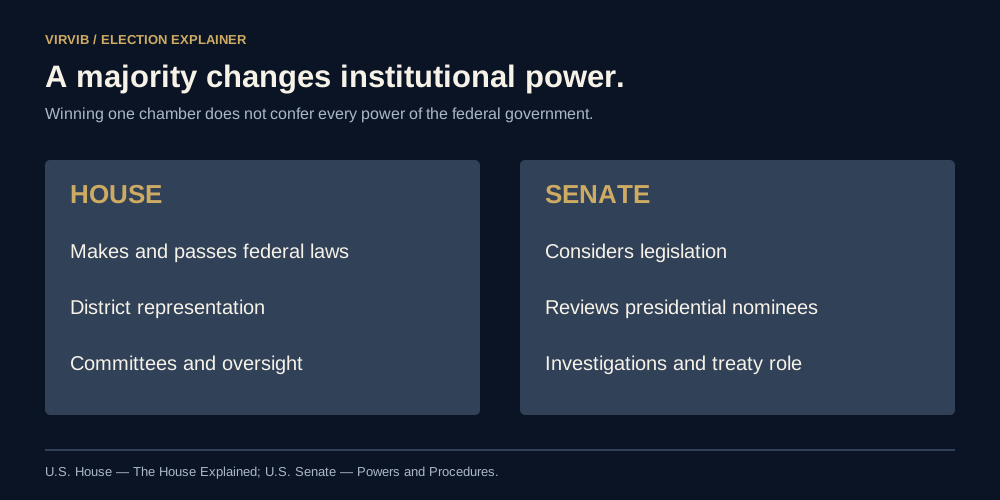
The House’s official explanation describes a chamber that makes and passes federal laws and organizes work through leaders and committees. The Senate’s account of its powers includes reviewing executive and judicial nominations, conducting investigations and considering legislation. It also explains the ordinary cloture threshold and the Senate’s role in treaties. Those powers are institutional reasons the midterms matter beyond the popularity of a president who is not on the ballot.
VIRVIB analysis: controlling one chamber can alter what receives a hearing, what gets investigated and which proposals reach the floor. It does not automatically give a party control over every step of federal policymaking. A campaign promise to “stop” a policy can conceal several separate mechanisms: legislation, appropriations, oversight, confirmation decisions and litigation are not interchangeable actions.
Readers assessing a candidate’s promise should identify the office the candidate seeks and the specific power needed to deliver the proposal. A Senate candidate cannot personally command all House votes. A House candidate cannot single-handedly approve a Supreme Court nominee. These examples do not favor either party; they connect the election to the institution being chosen. The forecast tells readers about possible winners. Understanding the chambers explains what those winners would be positioned to do, and why a narrow majority may behave differently from a larger one.
Sources: U.S. House — the House explained · U.S. Senate — powers and procedures
As of the sources reviewed on October 25, DDHQ gives Democrats the stronger position for House control and a much narrower advantage for Senate control. The four individually checked toss-ups show that close contests can still have a numerical favorite, and that the same percentage can belong to different parties in different states. Nothing in this snapshot constitutes a race call, a certified result or a guarantee about the composition of the next Congress.
VIRVIB analysis: the most useful next evidence is evidence that changes the underlying picture. A newly released poll needs its field dates and population. A candidate withdrawal needs ballot and timing context. A forecast update needs a source and a timestamp. A viral clip, a crowded rally or a search spike may be newsworthy without supplying any of those measurements. The explorer should help readers find the relevant contest rather than turn attention into an unsupported probability.
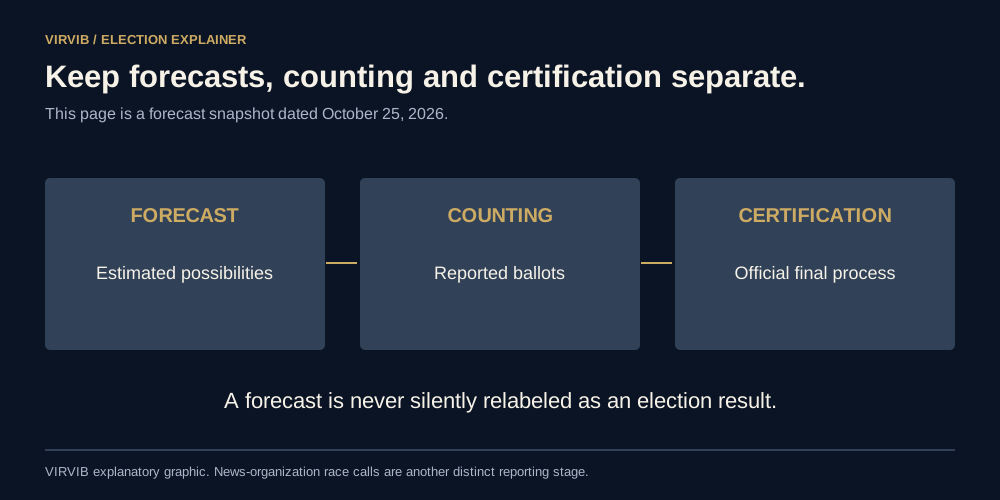
Election coverage also needs a transition rule. Before voting results arrive, these graphics show estimates and uncertainty. When counting begins, forecasts must not be silently relabeled as results. Official reporting, news-organization race calls and final certification are separate stages. The central question today is which side is favored under an identified model. The question after the election will be which candidates actually won. Keeping those questions separate is how a long election guide can remain useful before, during and after November 3.
Sources: DDHQ — 2026 Senate forecast · DDHQ — 2026 House forecast
The FEC’s 2026 master file contains 4,424 House and Senate registration records in this extract, including people who lost primaries and records that do not establish statutory candidacy. A filing is not proof of November ballot qualification. No forecast is assigned to these entries.
Search to load the FEC directory. Filing status is separate from model coverage.
This page is a dated October 25 snapshot, not an automatically updating election-night dashboard. DDHQ’s displayed model update is October 25 at 4:57 PM; the source does not specify the timezone on its summary. Its public model payload supplies names, party-level probabilities and race ratings. A party probability is not a personal probability for each name in a multi-candidate party entry. Values rounded to 100% in the source are shown here as >99%, and rounded zero as <1%, rather than certainty.
VIRVIB analysis prepared with AI assistance from linked records. No interviews or on-scene reporting claimed. No proprietary VIRVIB election model, independently verified vote-share projection, or live results feed is implied.